
To help policymakers and practitioners better leverage data to promote the transition to a green economy, the GGKP has developed a new green growth data visualization tool. The GGKP Data Explorer draws together 20 green growth datasets, covering 193 countries over the period 1960 to 2014. The data available in the tool is sourced from a number of GGKP partners including the OECD, the UN and the World Bank.
The Data Explorer offers a number of user-friendly tools to graph and visualize green growth patterns and trends including line charts, bubble charts and tables. In addition, users interested in deeper analysis of the data have the option to download the entire dataset.
Explore the Data
Datasets accessible through the tool are broken down into the following categories:
- Socio-Economic Context (e.g. GDP per capita, population, population density, GINI index, Human Development Index)
- Natural Asset Base (e.g. average annual deforestation, annual freshwater withdrawals per capita, agricultural land, terrestrial and marine protected areas)
- Environmental and Resource Productivity (e.g. CO2 emissions per capita, carbon productivity)
- Environmental Quality of Life (e.g. population exposure to air pollution, access to improve sanitation, access to improved water source, access to electricity)
- Policies and Economic Opportunities (e.g. fossil fuel consumption subsidies, environmentally related tax revenue, renewable electricity)
- Wealth Changes (e.g. changes in wealth per capita)
We encourage you to explore the data and share your findings with us using the hashtag #greendata.
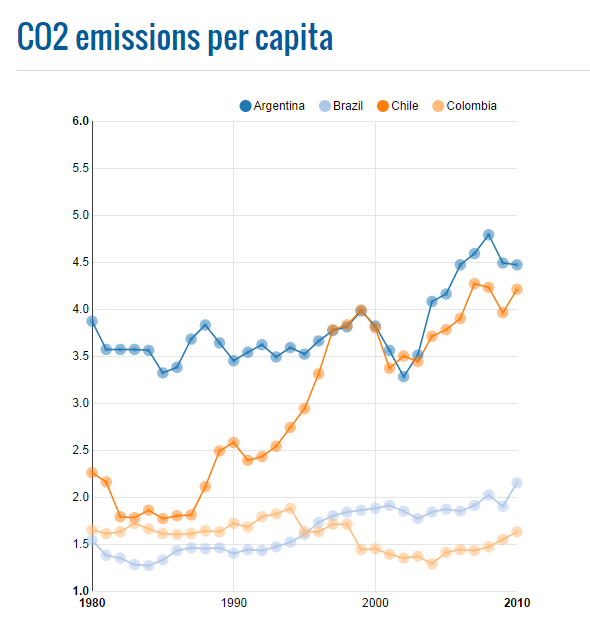
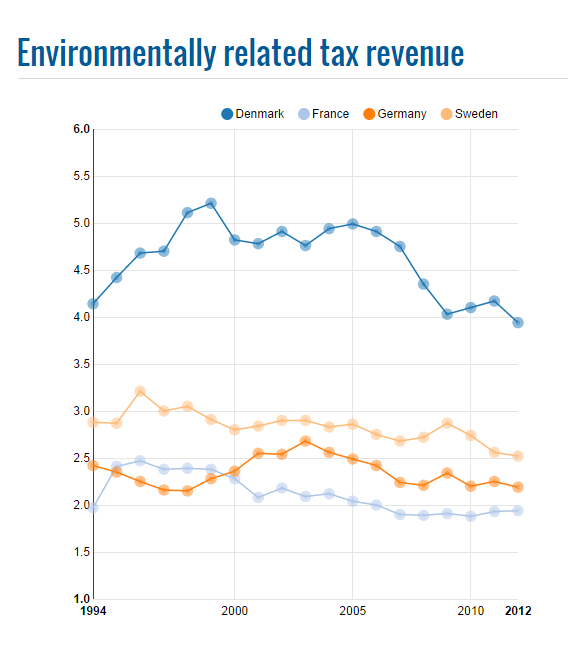
Line charts allow users to explore trends in indiviual datasets over time, analysing progress in relation to other countries.
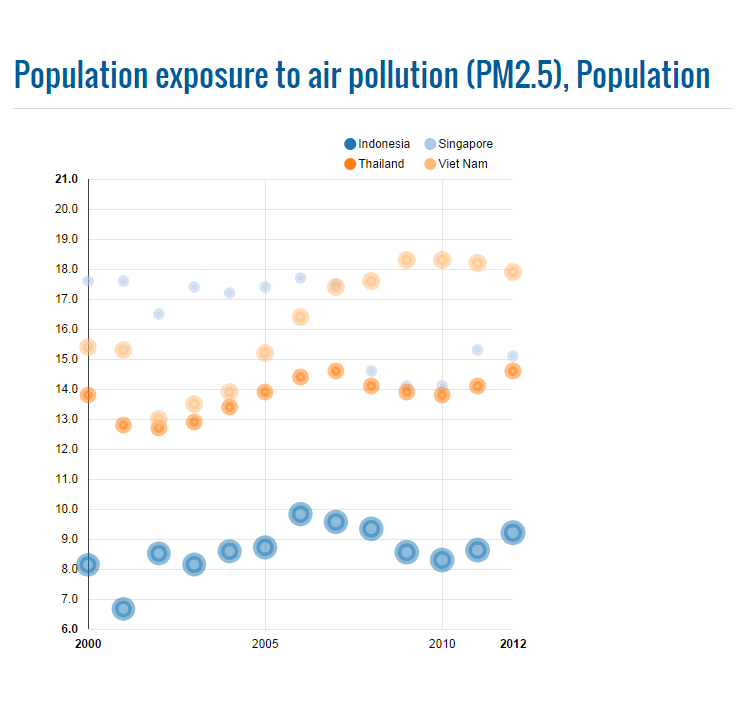
Bubble charts allow users to explore trends across two indicators over time. The y-axis measures the first indicator (e.g. population explore to air pollution) while the size of the bubbles captures the second indicator (e.g. population).
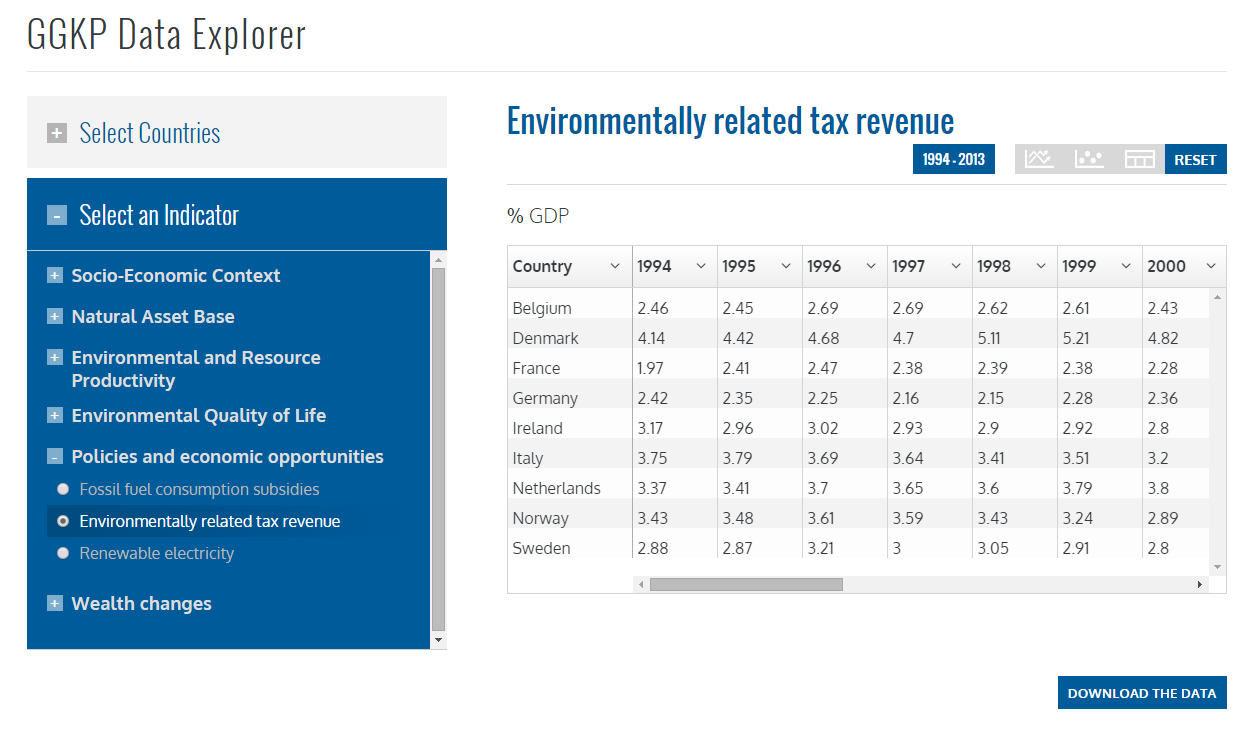
The interactive table option allows users to further filter through the data and sort it (ascending or descending) by year.